SQL Server Profiler in Azure Data Studio
Overview
The SQL Server Profiler extension for Azure Data Studio provides functionality similar to the traditional SQL Server Profiler tool in SQL Server Management Studio (SSMS). It tracks SQL Server events to help debug issues and analyze database activity.
While traditional Profiler has been widely used, Microsoft recommends Extended Events for production monitoring due to several advantages:
- Lower Performance Overhead - Extended Events minimize performance impact, making them suitable for continuous monitoring on production servers
- Greater Flexibility - More robust event handling with detailed and customizable data collection
- Better Integration - Seamless integration with modern SQL Server features and newer versions
- Scalability - Better performance with large data volumes and highly concurrent systems
The SQL Server Profiler extension in Azure Data Studio uses Extended Events technology while providing a familiar profiler interface.
Prerequisites
- Azure Data Studio installed
- SQL Server instance accessible from Azure Data Studio
- SQL Server Profiler extension installed in Azure Data Studio
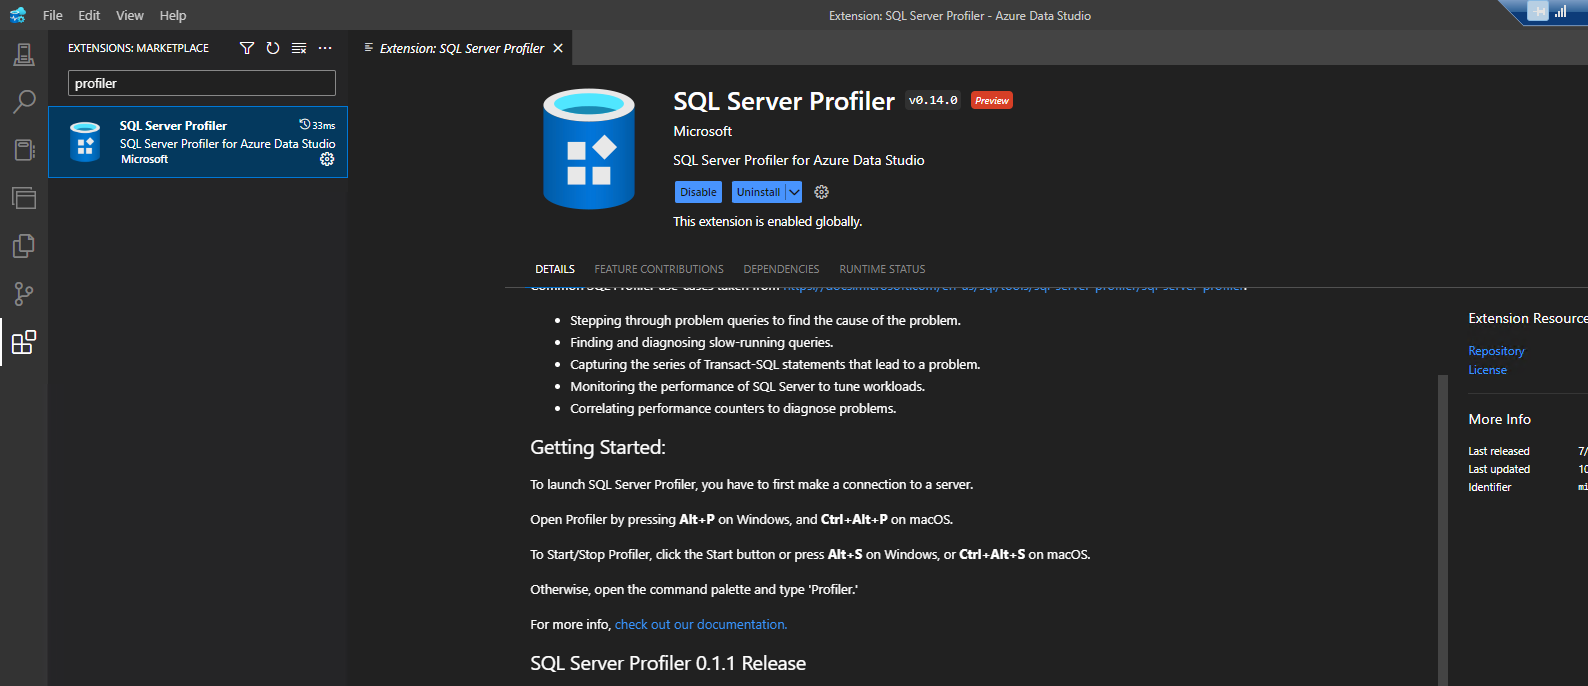
Install the SQL Server Profiler extension
-
Open Azure Data Studio.
-
Navigate to the Extensions view by clicking the square icon on the sidebar or pressing
Ctrl+Shift+X. -
Search for SQL Server Profiler in the search bar.
-
Click Install next to the extension. You may need to reload Azure Data Studio after installation.
Use SQL Server Profiler
-
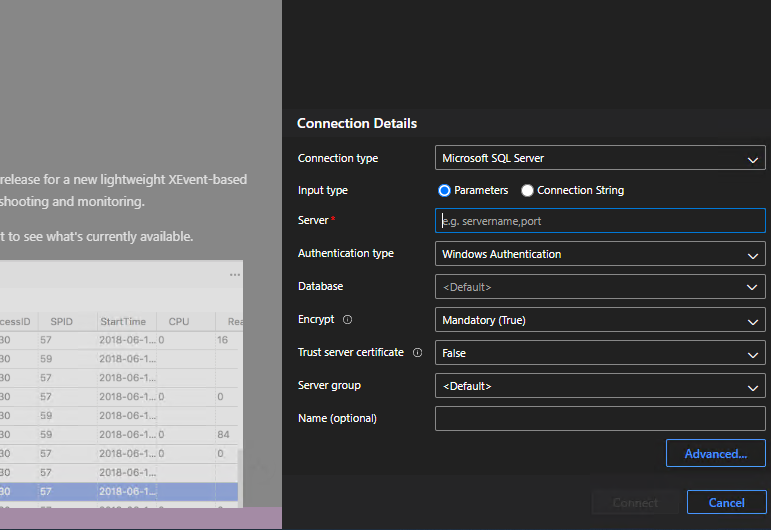
Open Azure Data Studio and connect to your SQL Server instance.
-
Navigate to the server or database you want to profile.
-
Open the Command Palette by selecting View > Command Palette from the top menu or pressing
Ctrl+Shift+P. -
Type Profiler: Launch Profiler and select it, or press
Alt + P. -
Select the connection you want to profile if not already selected.
-
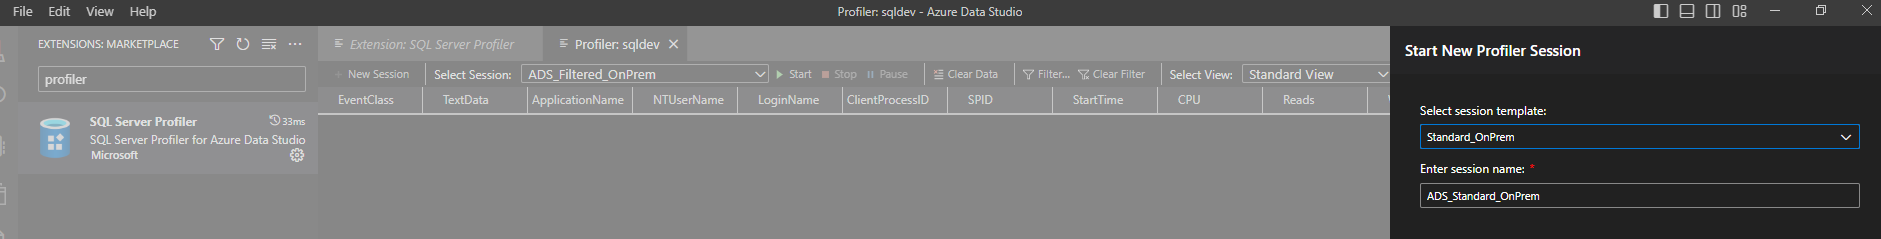
Choose a template that suits your analysis needs. Templates define which events are tracked and what data is collected.
-
Click Start to begin capturing events.
-
Immediately click Stop to pause the trace.
-
Change the session to ADS_Filtered_OnPrem from the session dropdown. This Extended Events session is optimized for EmpowerID environments as it filters only custom stored procedures and has lower performance overhead.
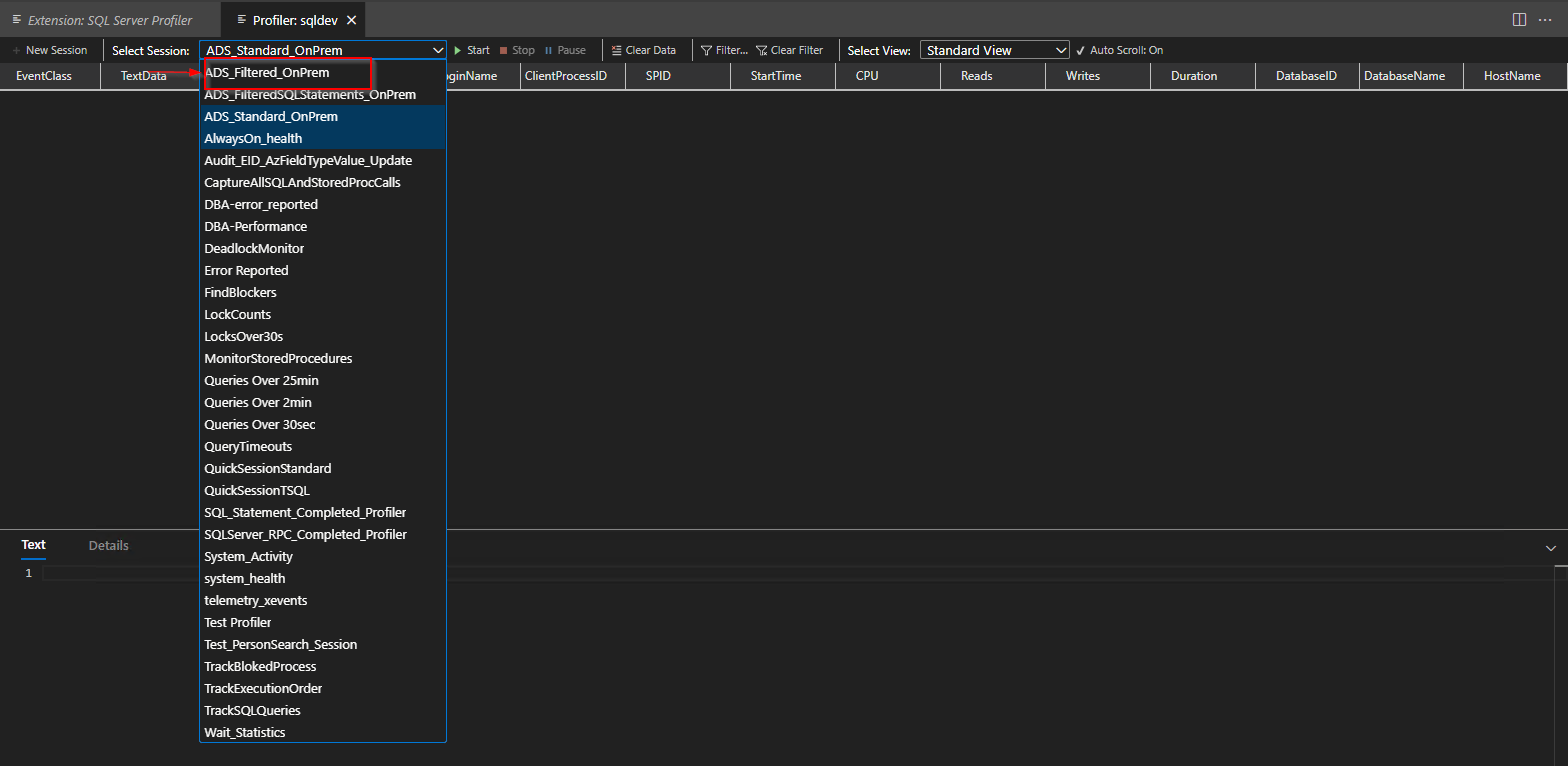
The initial template selection provides default settings, but switching to the ADS_Filtered_OnPrem session applies EmpowerID-specific filtering that reduces captured data volume and performance impact. This session focuses on custom stored procedures rather than all database activity.
-
Click the filter button to specify keywords for more targeted profiling.
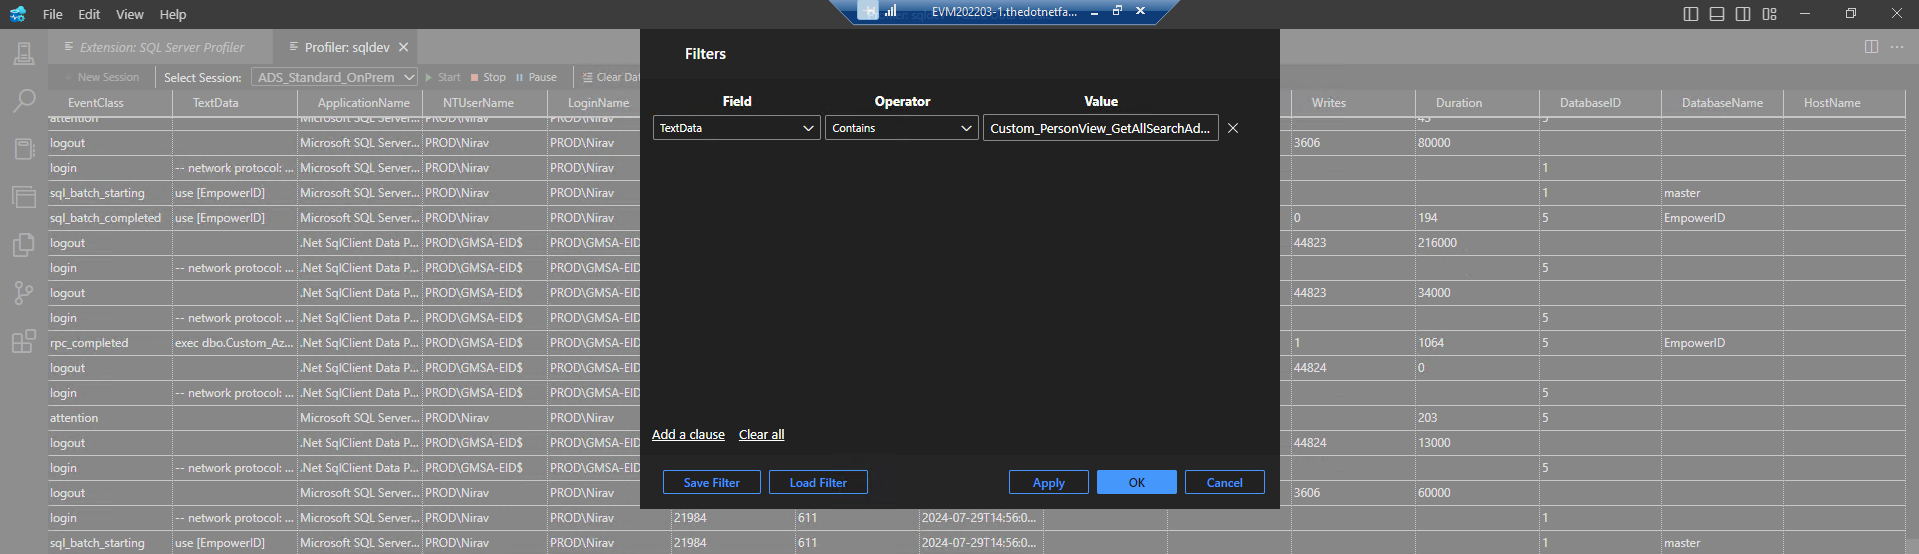
-
Enter the keywords or patterns you want to track (such as specific stored procedure names or database objects).
-
Click Start to resume capturing events with the configured filters.
Stop the profiler when you have gathered sufficient data to minimize performance overhead. While Extended Events are lighter than traditional profiler, continuous tracing still consumes resources.
-
Review the captured events displayed in the grid format.
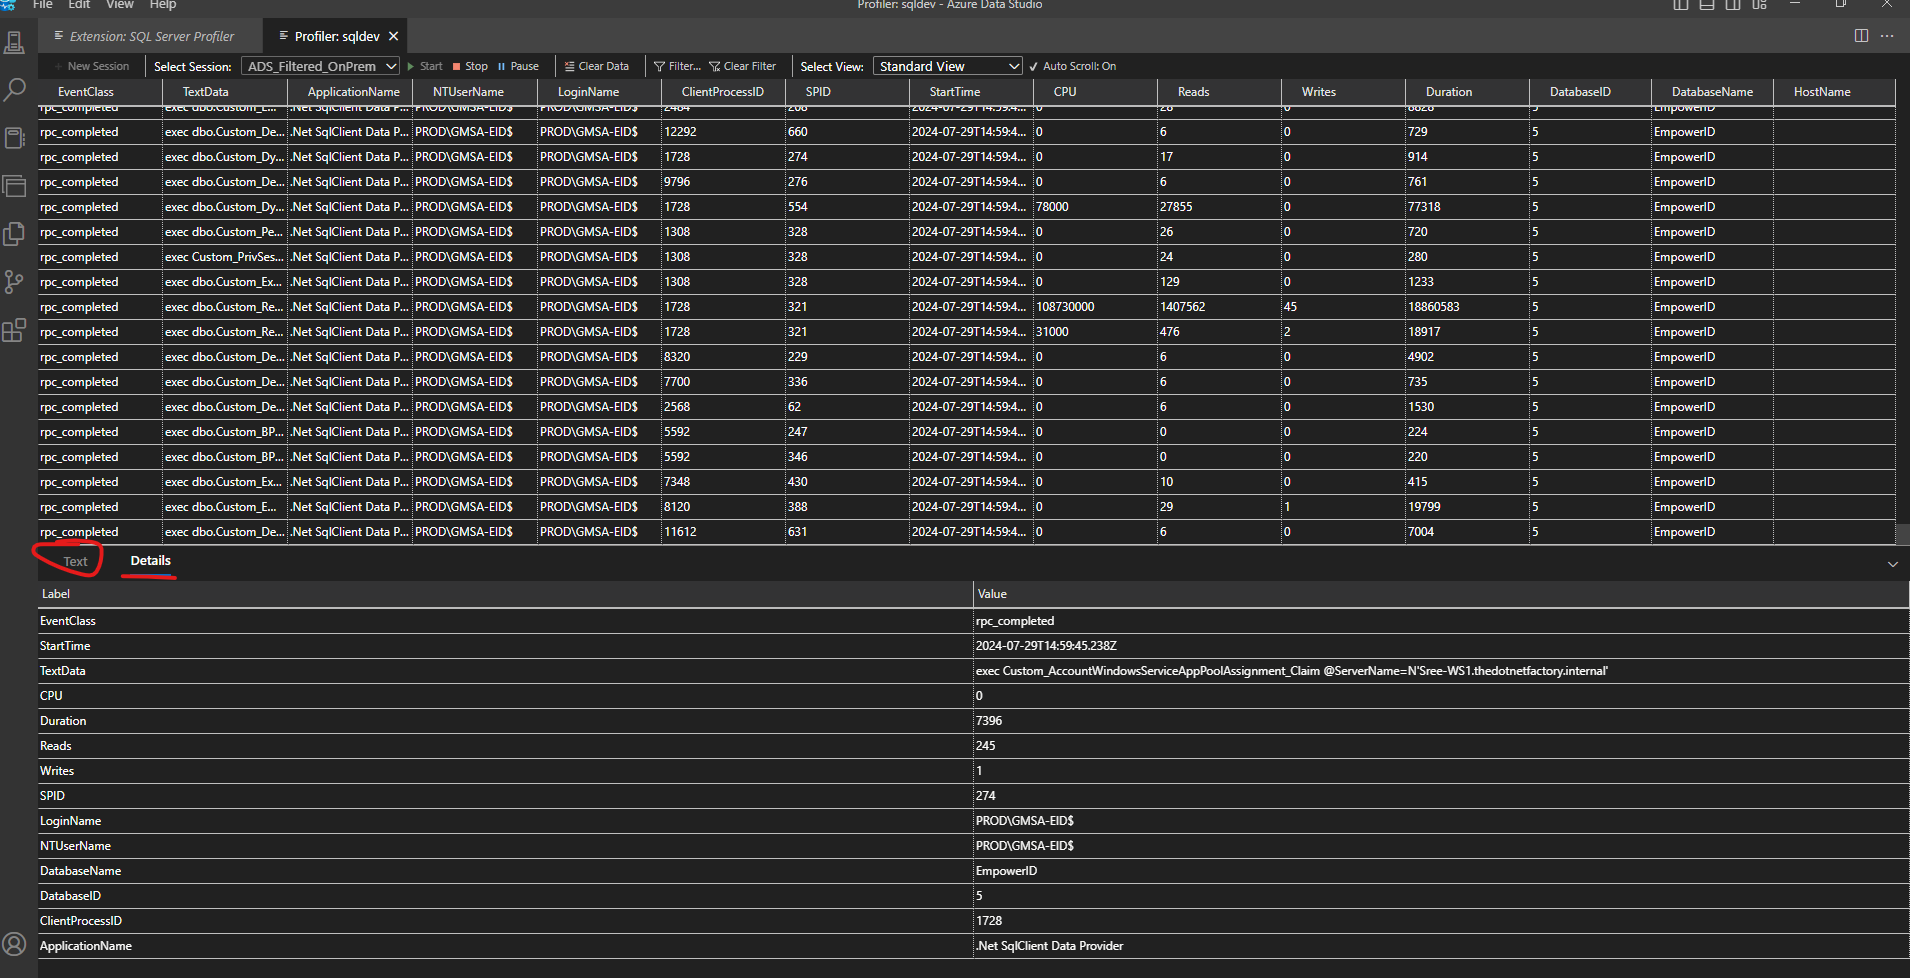
-
Analyze the events directly in Azure Data Studio or export the results for further analysis.
-
Click Stop when you have completed your analysis.
Save and load profiler sessions
To save the current profiling session:
- Click Save on the profiler toolbar.
- Choose a location and filename for the session file.
To load a previously saved session:
- Open the Command Palette (
Ctrl+Shift+P). - Type and select Profiler: Open Profiler.
- Navigate to and select the saved session file.